

Data Analytics
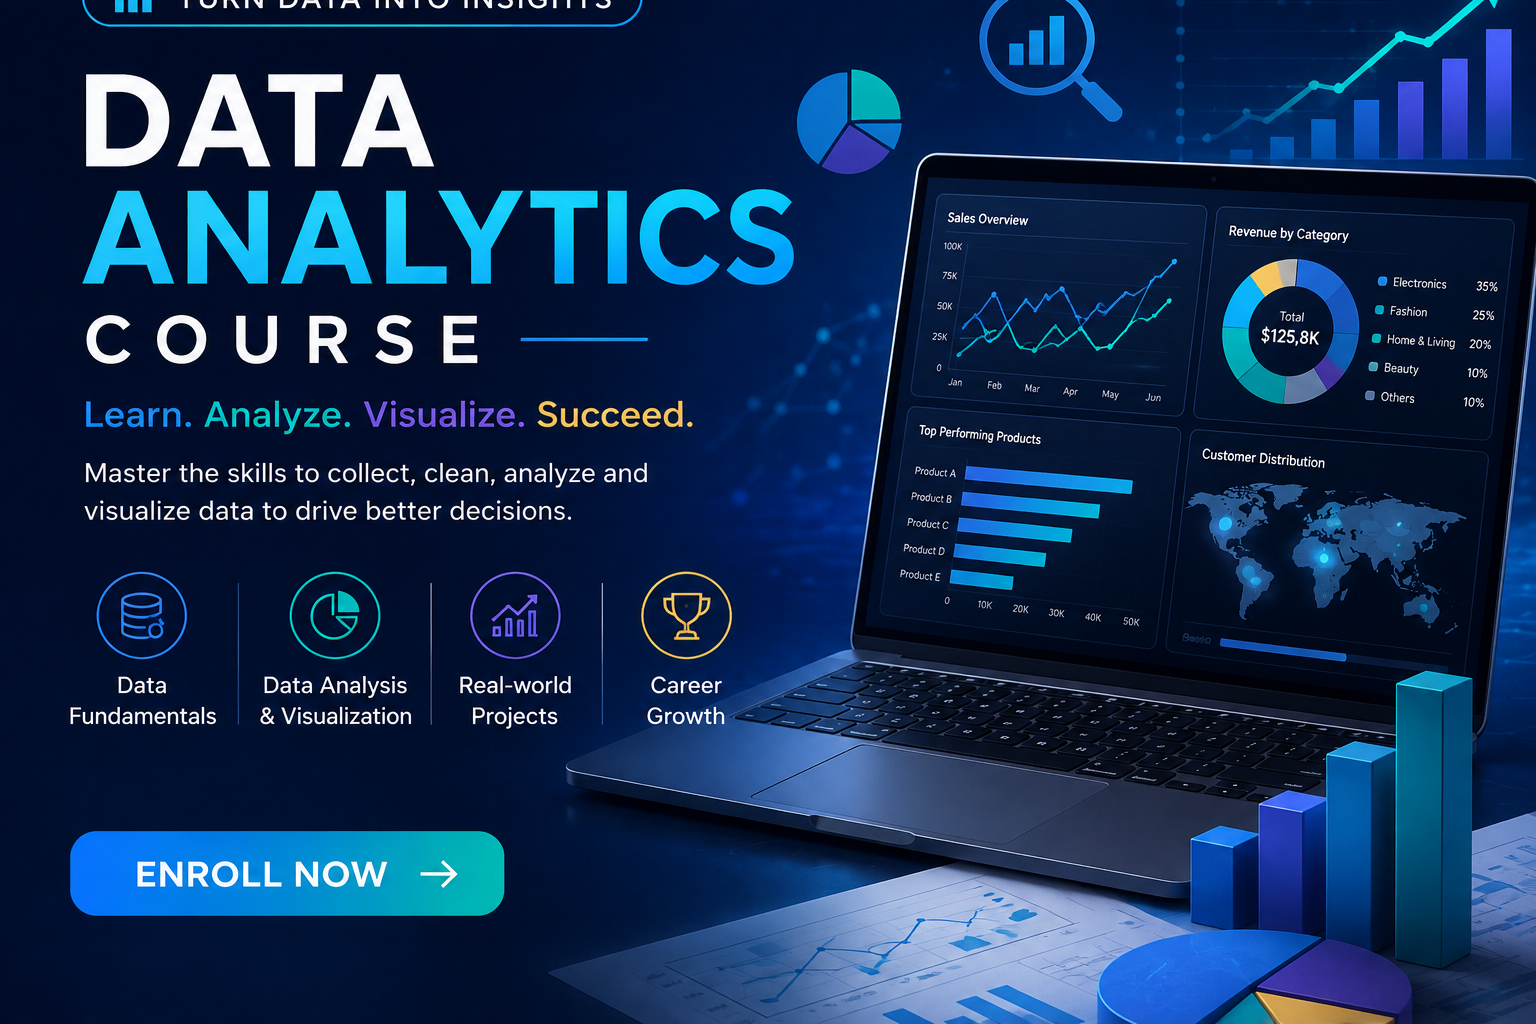
Master Data Analytics with Excel, SQL, Power BI, Python, and Tableau. Transform raw data into actionable business insights.
Course Highlights
About this Course
Our comprehensive Data Analytics course is designed to transform you into a skilled data analyst. Learn from industry experts and gain hands-on experience with real-world projects. This course covers everything from Excel fundamentals to advanced Python analytics and Power BI dashboards, preparing you for exciting careers in data analytics and business intelligence.
Course Information
Data Analytics Curriculum
Comprehensive curriculum designed to make you industry-ready
You'll Master These Tools
Learn industry-leading Data Analytics, Business Intelligence, and Programming tools through hands-on projects and real-world applications.
 Excel
You'll Learn
- Advanced Formulas
- Pivot Tables
- VLOOKUP & INDEX-MATCH
- Data Validation
- Macros & VBA
- Power Query
 SQL
You'll Learn
- SELECT Queries
- JOINs & Subqueries
- Window Functions
- Stored Procedures
- CTEs
- Database Design
 Power BI
You'll Learn
- Data Modeling
- DAX Formulas
- Power Query
- Interactive Dashboards
- Row-Level Security
- Report Publishing
 Python
You'll Learn
- Pandas
- NumPy
- Matplotlib
- Data Manipulation
- EDA
- File Handling
 Pandas
You'll Learn
- DataFrames
- Data Cleaning
- GroupBy Operations
- Merging & Joining
- Time Series
- Data Transformation
 NumPy
You'll Learn
- Arrays
- Mathematical Operations
- Broadcasting
- Linear Algebra
- Statistical Functions
- Array Manipulation
 Matplotlib
You'll Learn
- Line Charts
- Bar Charts
- Scatter Plots
- Histograms
- Subplots
- Custom Visualizations
 Tableau
You'll Learn
- Data Connections
- Calculated Fields
- Interactive Dashboards
- Storytelling
- Filters
- LOD Expressions
Practical Training & Real-Time Analytics Projects
Build industry-ready Data Analytics solutions through hands-on projects using Excel, SQL, Power BI, Python, and Tableau.
Sales Dashboard Creation
Build comprehensive sales dashboards using Power BI to track revenue, sales performance, regional analysis, and trend forecasting for business decision-making.
Customer Segmentation Analysis
Perform customer segmentation using clustering techniques in Python to identify customer groups, buying patterns, and targeted marketing strategies.
Financial Reporting Automation
Automate financial reports using Excel macros and SQL queries to streamline monthly reporting, variance analysis, and executive dashboards.
Marketing Analytics Report
Analyze marketing campaign performance, ROI tracking, customer acquisition costs, and channel effectiveness using SQL and Power BI visualizations.
HR Analytics Dashboard
Create HR dashboards tracking employee metrics, attrition analysis, recruitment pipeline, performance reviews, and workforce planning insights.
Supply Chain Analytics
Optimize supply chain operations through inventory analysis, demand forecasting, vendor performance tracking, and logistics optimization dashboards.
Course Duration
Our Valued Placement Partners
Our learners get placed in top companies across India and globally.






Student Reviews
Priya Sharma
2 weeks ago
The Data Analytics course at ASP Infotech is fantastic! The hands-on projects with Power BI and SQL gave me real confidence. I landed a Data Analyst role within a month of completing the course.
Rahul Kumar
1 month ago
Excellent course content and supportive faculty. The Python and Excel modules were very detailed. The placement assistance helped me get interviews at top companies.
Sneha Patel
3 weeks ago
Best investment in my career! The capstone projects gave me a strong portfolio. The instructors are industry professionals who provide practical insights beyond just theory.
Our Students Got Placed
Real stories from our successful students who built their careers with ASP Infotech

Barbeque Nation
Akash Kumar Das

Startek
Ankit Kumar Singh

SDM System & Solution Private Limited
Annu Kumari

TCS
Arindam Nandy

Royal Enfield
Arpan Mondal

Volt Wheel
Arup Dutta

Tech Mahindra
Bhaswati Das

Cyber A1
Debaditya Ghosh

MedPlus Pharma
Iftekar Jaman Khadim

Barbeque Nation
Karan Mishra

Pinnacle
Mamita Roy

Zoblik Technologies
Manisha Pandey
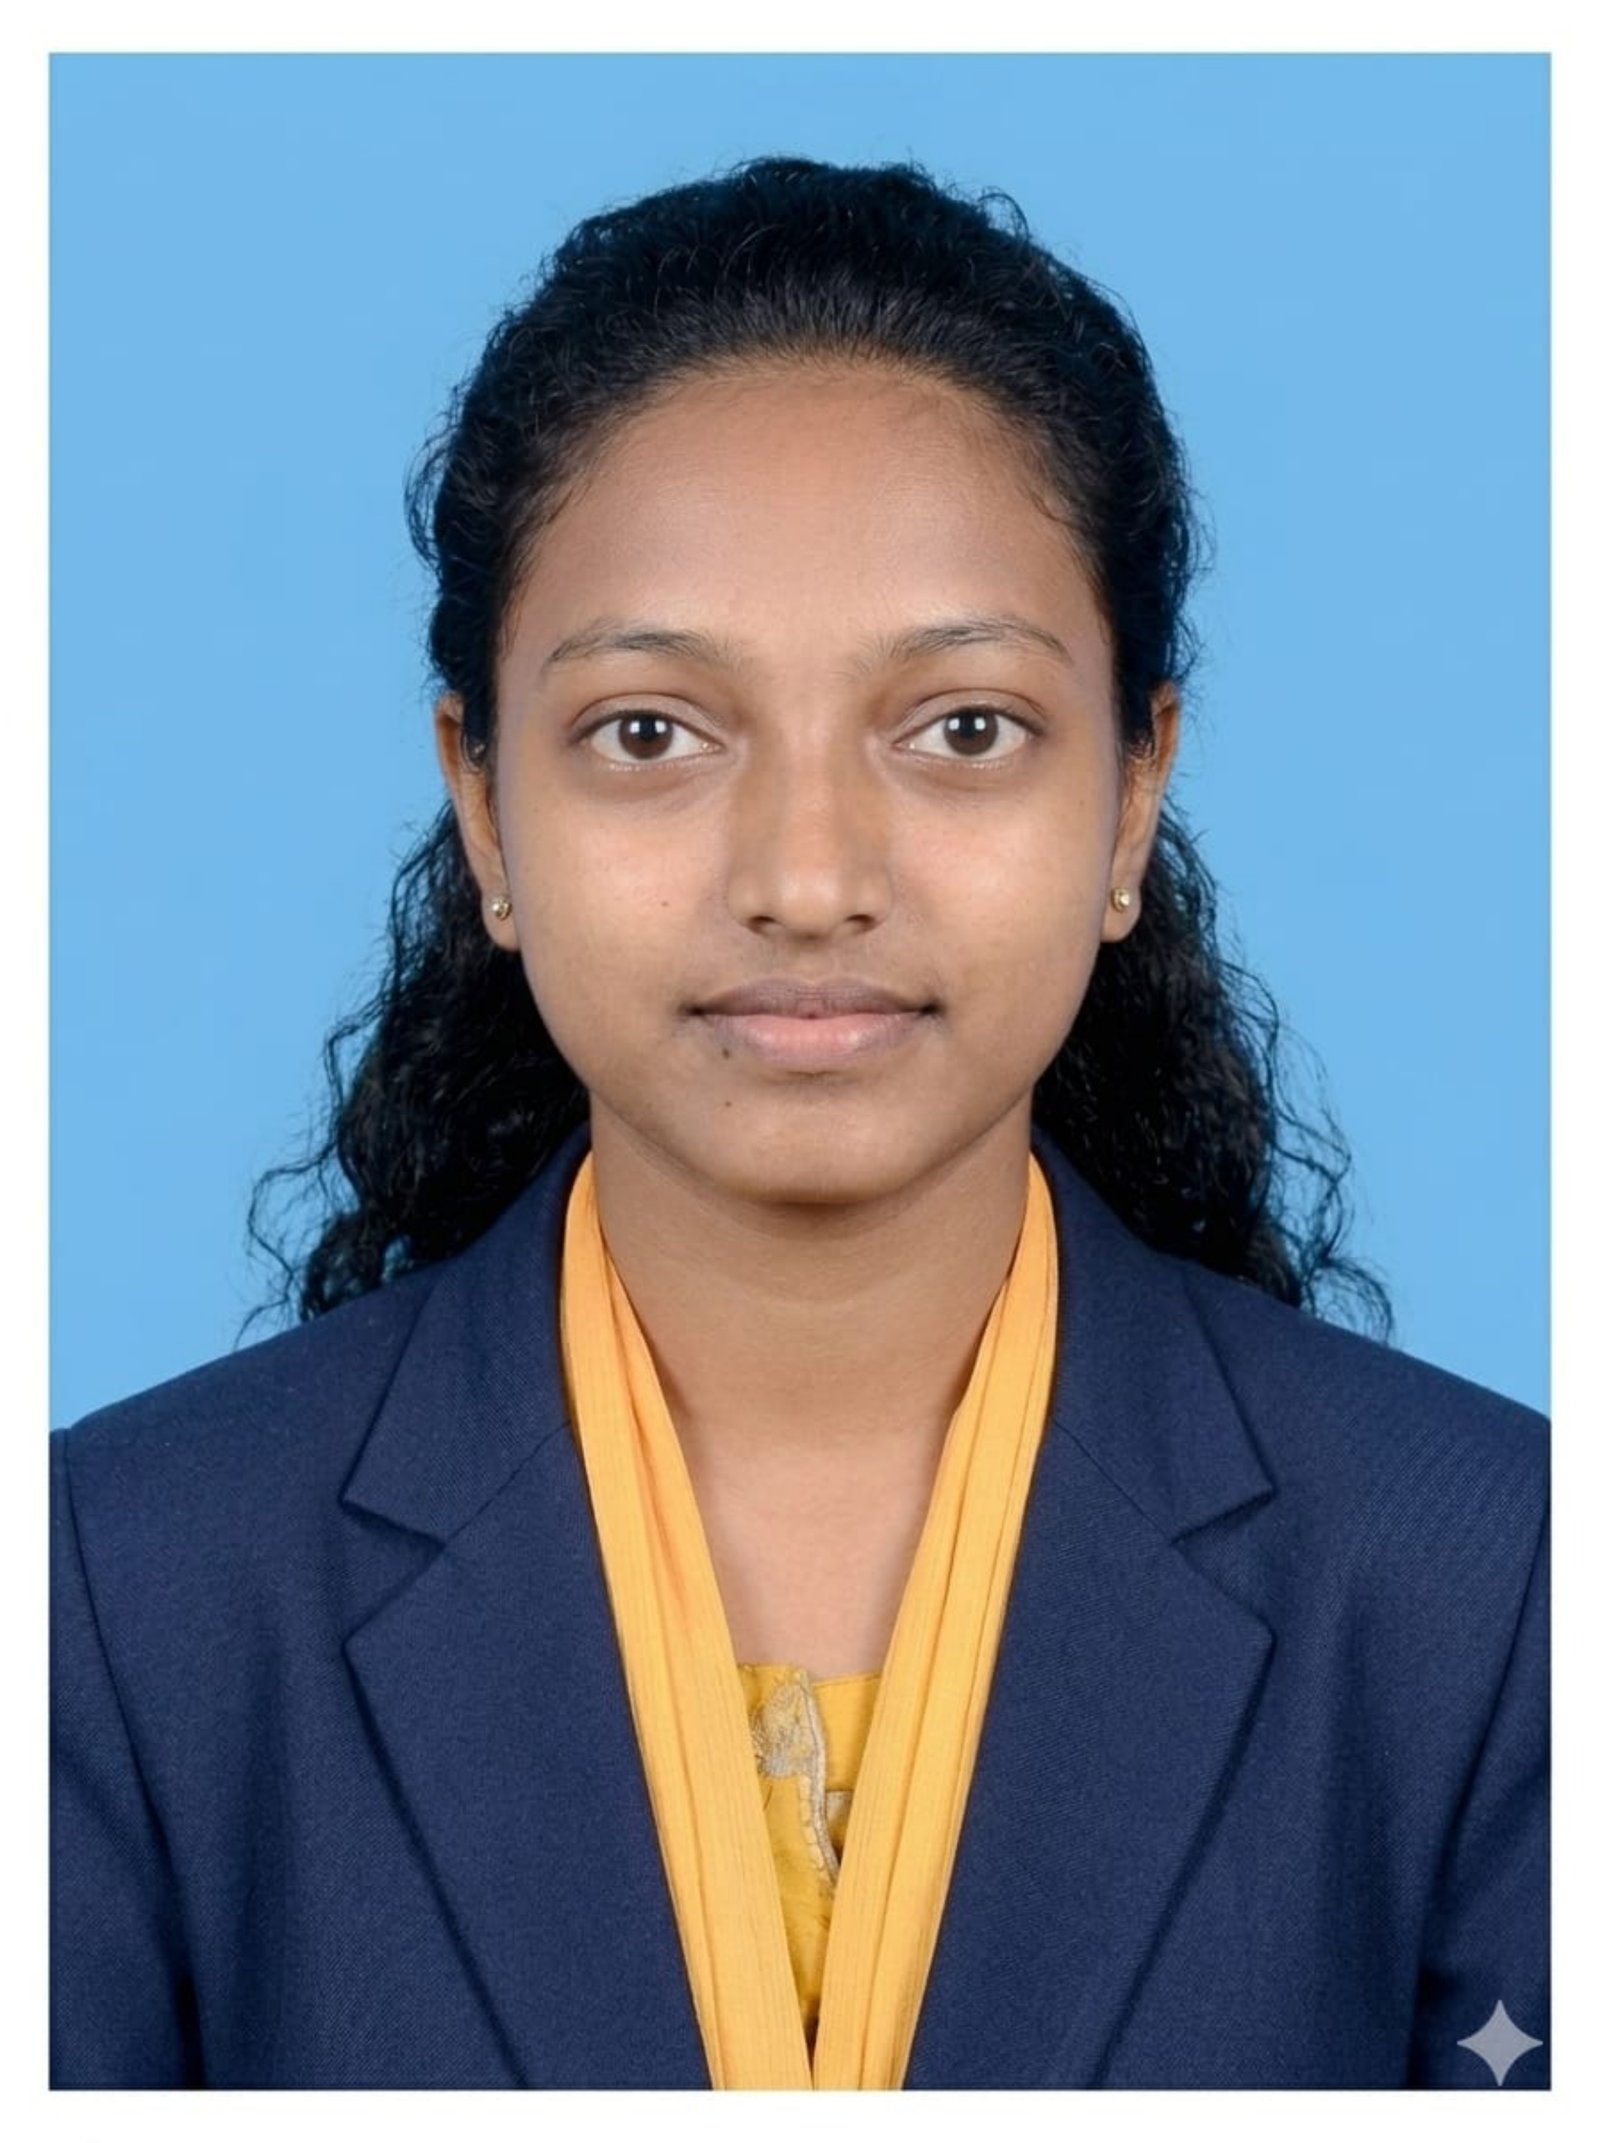
Fusion
Megha Tudu

Globiva
Monika Das

Fusion BPO
Nilima Layek

ASP Infotech
Pawan Paswan

Cyber A1
Pius Ghosh

Team Lease
Punam Mahanta

TVS
Rajesh Kumar Jaiswara

Innov
Ruchika Tiwari

Pundik Business Service
Saonty Hazra

CognoRise Infotech
Shivangi Singh

Webrl IT
Shubhojit Chowdhury

Pundik Business Service
Sonali Maji

Cyber A1
Sudhansu Orang

MedPlus Pharma
Takki Ahmad

Jana Small Finance Bank
Waquar Ahamed

ASP Infotech
Priyanka Chowdhury
Ready to Start Your Journey?
Join thousands of students who have transformed their careers with ASP Infotech.